重复检验的目标
在评估非线性拟合时,您可能会问:曲线是否与数据点“相差太远”。 当然,答案本身又引出了另一个问题:与什么相比才算太远?如果每个 X 值仅收集了一个 Y 值,您实际上无法回答这个问题(除非参考其他类似实验)。但如果您在每个 X 值处都收集了重复的 Y 值,那么您就可以考察数据点到曲线的平均距离,与重复样本之间的离散程度相比,是否“太远”。
如果您输入了重复的 Y 值,请选择“重复数据检验”来判断数据点是否“偏离”曲线过远(相对于重复数据之间的离散程度)。如果 P 值较小,则可得出结论:曲线与数据的拟合不够紧密。
示例
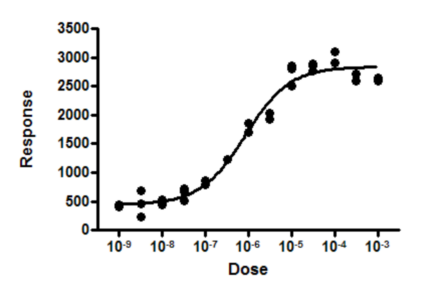
最后两次给药后的反应略有下降。这是巧合吗?还是双相反应的证据?
解决此问题的一种方法是指定一个替代模型,然后比较两个拟合结果的平方和。在本示例中,可能尚不明确应选用哪种双相模型作为替代模型。而且,若未先收集更高剂量的数据,在本示例中深入研究双相模型可能毫无意义。
由于每个剂量下都获得了重复测量值,这些重复值之间的离散程度使我们能够评估曲线是否“偏离”数据点过远。
在“诊断”选项卡中勾选执行重复检验的选项后,Prism 报告了以下结果:
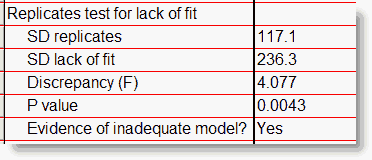
第一行中的数值量化了重复测定结果的离散程度,本质上是将所有 X 值的标准偏差合并为一个数值。该数值仅基于重复测定结果之间的变异性,无需进行任何曲线拟合即可计算。如果重复测定结果差异很大,该数值就会很高;如果重复测定结果非常一致,该数值就会很低。
第二行数值量化了曲线与重复测定均值的贴合程度。若曲线紧贴重复测定均值,该数值较低;若曲线远离部分均值,该数值较高。
第三行(F)是这两个标准差值之比的平方。
如果模型正确,且所有离散点都是围绕模型的高斯随机变异,那么这两个标准差值很可能相近,因此 F 值应接近 1。在本示例中,F 值大于 1,因为“模型拟合不足”的标准差远大于重复测量的标准差。P 值回答了以下问题:
如果模型选择正确且所有离散数据均服从高斯分布,那么得到一个远大于1.0的F比值的概率是多少?
较小的P值表明,数据实际上遵循的模型与您所选的模型不同。在本示例中,这暗示某种双相剂量-反应模型可能是正确的 - 即最后几个数据点的下降并非仅仅是巧合。
重复检验的计算方法
关于这种拟合不足检验的详细讨论可见于线性和非线性回归的高级教材(1,2),非线性回归教材中也有简要提及(3, 4)。以下是对该方法的简要说明:
重复检验的标准差(SD)是通过将每个重复测量值与该组重复测量均值之间距离的平方相加来计算的。将该和除以其自由度(总数据点数减去X值的个数),再取平方根。该值仅基于重复测量之间的变异性,且无需进行任何曲线拟合即可计算。
拟合不足标准差(SD lack of fit)则稍难理解。将每个重复值替换为该组重复值的均值。然后计算这些点与曲线之间距离的平方和。如果存在三重复值,则将三个重复值中的每一个替换为这三个值的均值,计算该均值与曲线之间的距离平方,并将该平方值计入总和三次(每个重复值各一次)。 现在将该平方和除以其自由度(数据点数减去参数数再减去X值数),并求其平方根。
F 比值即为两个标准差之比的平方。
P 值是根据 F 比值和上述定义的两个自由度值计算得出的。
参考文献
1.《应用回归分析》,N. Draper 和 H. Smith 著,Wiley Interscience 出版社,第 3 版,1998 年,第 47-56 页。
2.《应用线性统计模型》,M·库特纳、C·纳赫茨海姆、J·内特、W·李著,欧文/麦格劳-Hill出版社;第 5 版(2004 年 9 月 26 日),第 119-127 页
3.《非线性回归分析及其应用》,D.M. Bates 和 D.G. Watts 著,Wiley Interscience 出版社,1988 年,第 29-30 页。
4.《非线性回归》,CAF Seber 和 CJ Wild 著,Wiley Interscience 出版社,2003 年,第 30-32 页。