1. 输入数据
选择一个列表和一个列散点图。如果您尚未准备好输入自己的数据,可以从“欢迎对话框”中选择列表示例数据“频率分布”。
2. 选择分析
点击“分析”,然后从列数据的分析列表中选择“频率分布”。
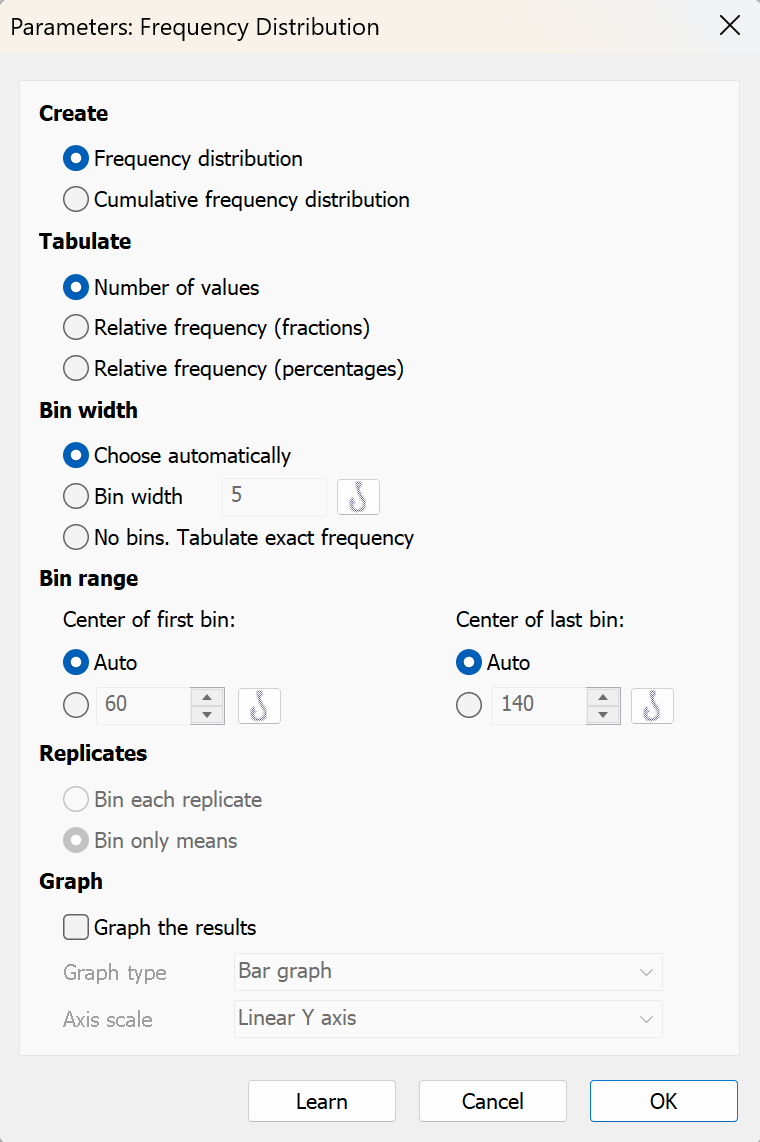
3. 选择分析选项
累积?
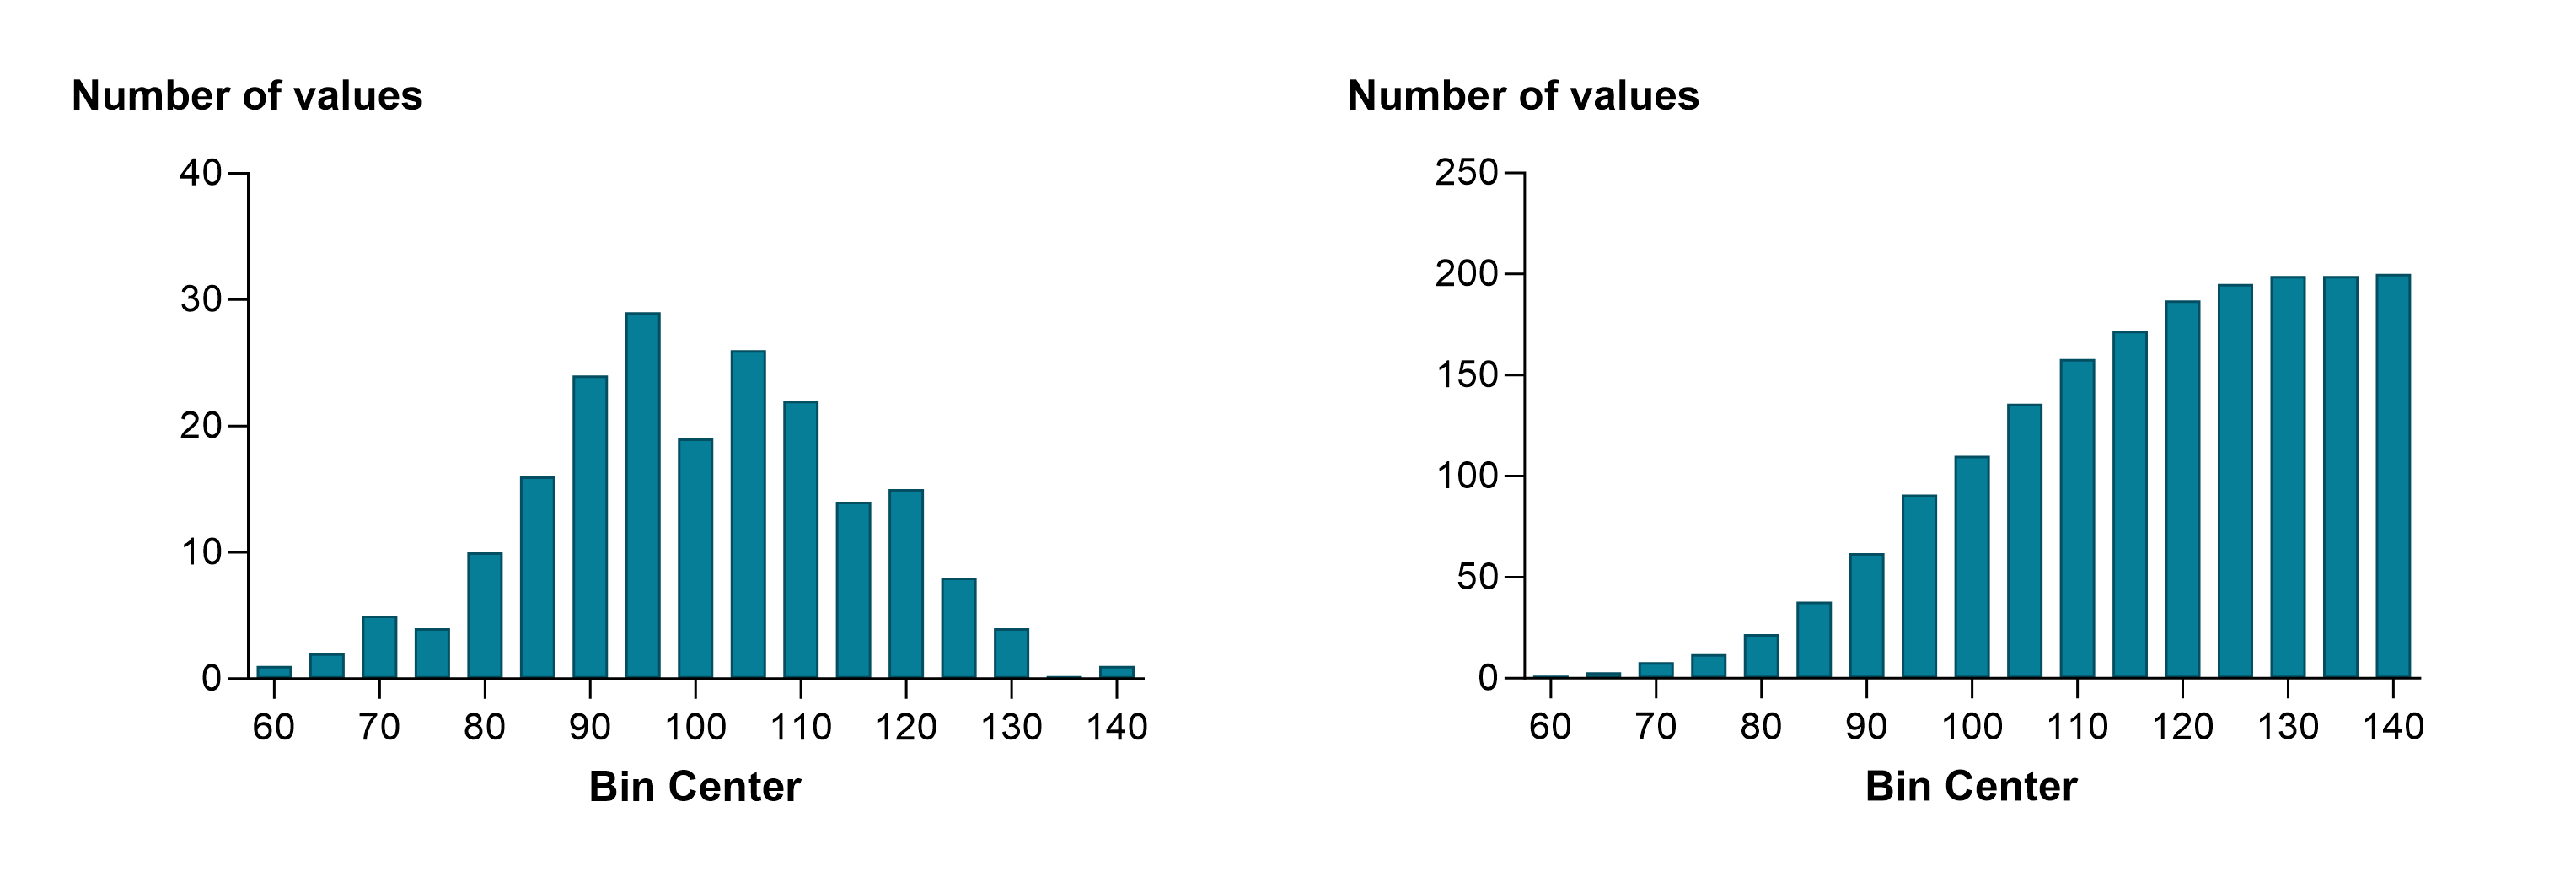
在频率分布中,每个区间包含落在该区间定义值范围内的数值个数。在累积分布中,每个区间包含落在该区间内或低于该区间的数值个数。根据定义,最后一个区间包含总数值个数。下图左侧显示的是频率分布图,右侧显示的是同一数据的累积分布图,两者均绘制了每个区间的数值个数。
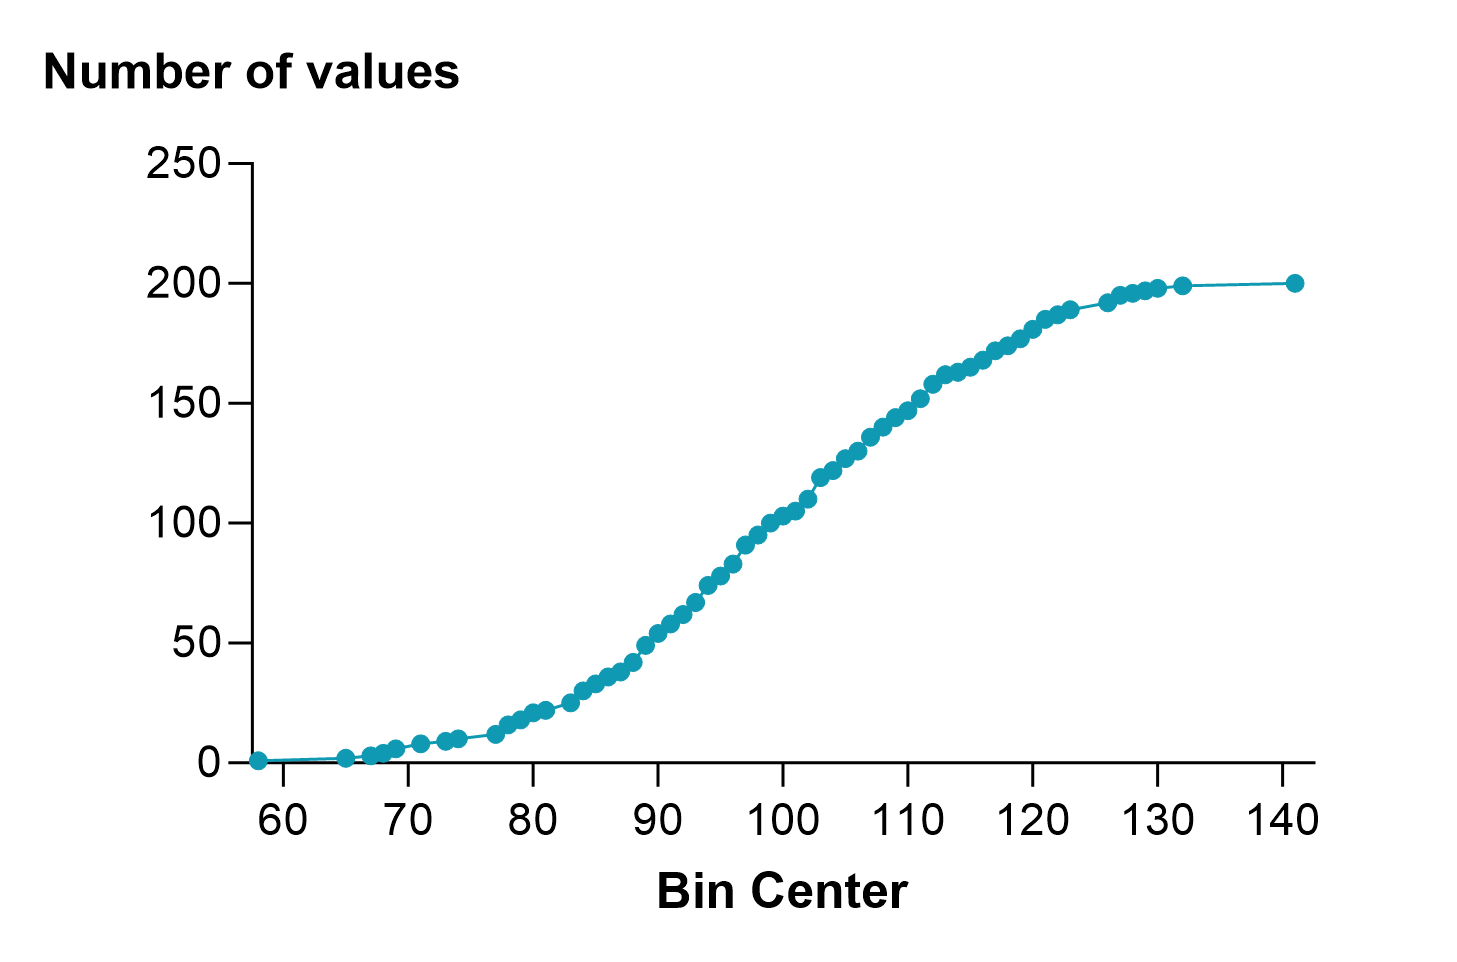
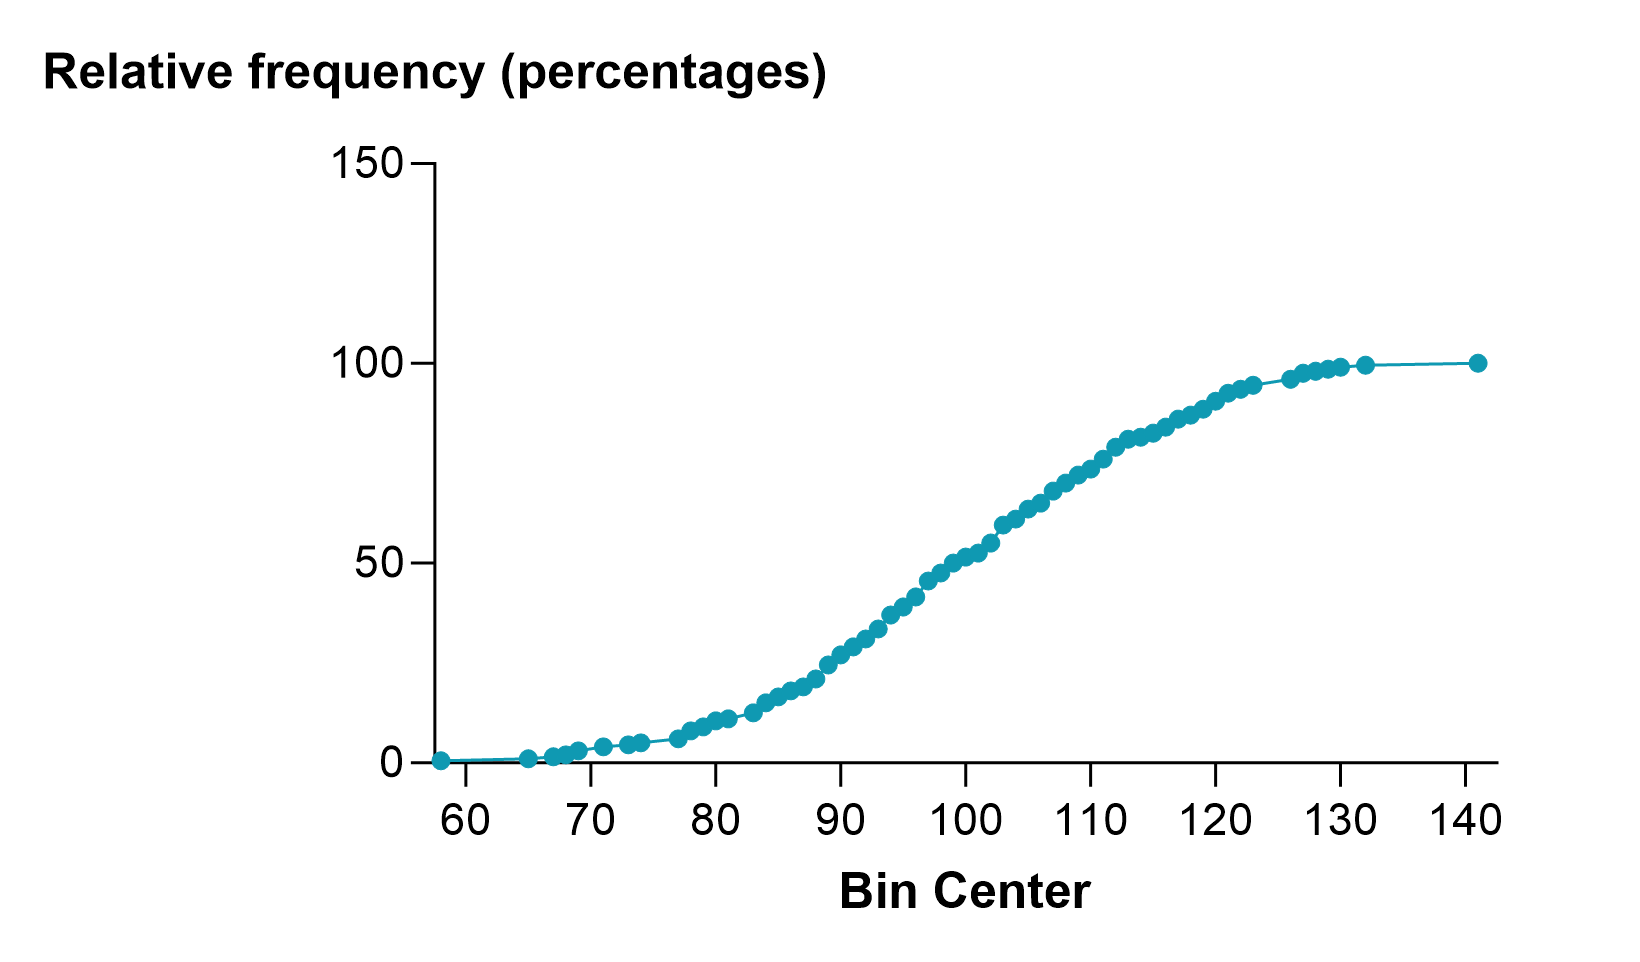
累积分布的主要优势在于无需确定箱宽。相反,您可以像左侧所示那样绘制精确的累积分布。该数据集包含 200 个值,因此该精确累积分布有 200 个数据点,使其看起来略显参差不齐。 当您选择将累积频率分布以百分比形式而非分数或精确计数进行制表时,这些百分比实际上是百分位数,所得图表有时被称为百分位数图(如下图右侧所示)。
相对频率或绝对频率?
选择“相对频率”可计算每个区间内值的占比(或百分比),而非该区间内的实际值数。例如,如果 45 个值中有 15 个落在某个区间内,则相对频率为 0.33 或 33%。
若同时选择累积频率和相对频率,即可使用概率坐标轴绘制分布图。采用这种绘制方式时,高斯分布呈线性。下图是使用先前相同数据的示例。在此情况下,数据大致服从正态分布,因此图形基本呈直线。

箱宽
如果您选择了累积频率分布,建议您选择创建精确频率分布。在这种情况下,您无需选择箱宽,因为每个值都会单独绘制。
若要创建普通频率分布,必须确定一个箱宽。如果箱宽过大,区间数量将很少,因此无法清晰地了解值的分布情况。如果箱宽过小,许多区间可能只包含少数几个值(甚至没有),导致相邻区间中的值数随机波动剧烈,从而无法把握数据的分布特征。
需要多少个区间?这部分取决于您的目标,部分取决于样本量。如果样本量较大,您可以设置更多区间,同时仍能获得平滑的频率分布。一个经验法则是:将区间数设为样本量的以2为底的对数。Prism在生成自动箱宽时,将此作为其两个目标之一(另一个目标是使箱宽为整数)。
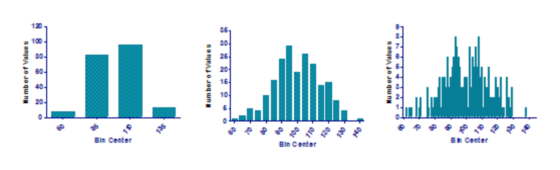
下图展示了同一组数据在三种不同箱宽下的情况。中间的图表显示了数据的分布情况。左侧的图表细节不足,而右侧的图表则细节过多。
分箱范围
除了决定箱宽(这决定了区间的数量)外,您还可以选择第一个区间的中心值。这一点可能很重要。假设您的数据是百分比,范围从 0 到 100。数据不可能小于 0(负数)或大于 100。假设您希望箱宽为 10,从而形成 10 个区间。 如果第一个区间以 0 为中心,它将包含 -5 到 5 之间的值,下一个区间将包含 5 到 15 之间的值,再下一个区间包含 15 到 25 之间的值,以此类推。由于不可能出现负值,第一个区间实际上只包含 0 到 5 之间的值,因此其有效箱宽仅为其他箱宽的一半。另外请注意,包含数据的区间共有 11 个,而不是 10 个。
如果将第一个区间中心设为5,它将包含0到10之间的值,下一个区间包含10到20之间的值,以此类推。现在,所有区间确实都包含相同的数值范围,且所有数据都包含在十个区间内。
位于区间边界上的数据点应归入包含较大值的区间。因此,如果一个区间的范围是 3.5 到 4.5,而下一个区间的范围是 4.5 到 5.5,那么数值 4.5 就会被归入第二个区间(4.5 到 5.5)。
重复测量
如果您输入了重复测量值,Prism 可以将每个重复测量值放入相应的区间,或者对重复测量值求平均值,并仅将平均值放入一个区间。
所有小于第一个区间阈值的数值都将从分析中剔除。您还可以输入一个上限值,以将大于该值的数值从分析中剔除。
如何绘制图表
请参阅本示例。
|
Prism 只能根据数值数据生成频率分布。它虽然可以处理分类数据,但前提是这些类别必须以数值形式输入。 |
